Python and Matplotlib Data Visualization
-
 By
Stone River eLearning
By
Stone River eLearning
- 15/04/2022
Course Description
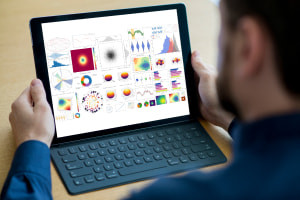
In this course, 'Python and Matplotlib Data Visualization,' you will learn how to download Matplotlib and set it up on your computer. You will study the different code editors you can use for Python before exploring the basics of working with Matplotlib. Then we explain some of the basic plotting options and how we can use Matplotlib. Are you wondering what role titles play in our plots and why we use them? We will answer this question and go through histograms and customizing legends, titles and labels in Matplotlib.
The course will then demonstrate various adjustments you can make with Matplotlib. We will use shared data that consists of multiple series to do this. When analyzing stock data, we will investigate how we can interpret price and volume data and transform the data in various ways. Next, we will learn to create a function that converts data based on the given information. We will also look at how to add grids and change labels. Finally, discover how to create your own styles, use some premade styles and edit them. We cover topics that teach you to make live charts and update them as the reading data changes.
Learning how to subplot with Matplotlib is convenient. We will discuss how to add multiple plots to a figure and plot multiple series at once. In addition, we explain indicators, like moving averages, and how we can add them to our charts. Are you wondering about the features of 3D charts and how we can use them with Matplotlib? The 3D charts provide three axes and three dimensions to plot and are very useful for plotting data in charts. We will cover all of these topics, such as 3D dot plots, wireframes and bar charts, and explore a range of 3D representations of graphs. This course is ideal for students who want to learn more about data science with Python or professionals who wish to brush up on their Python programming skills. So why wait? Start your learning journey today.
What you'll learn in this course?
-
Technology
-
Data Science
-
Python
-
Data Visualization
Course Curriculum
Stone River eLearning
USA